一、概述
go 的 pprof 工具可以用来监测进程的运行数据,用于监控程序的性能,对内存使用和 CPU 使用的情况统信息进行分析。
官方提供了两个包:runtime/pprof 和 net/http/pprof,前者用于普通代码的性能分析,后者用于 web 服务器的性能分析。
官方文档:
https://golang.org/pkg/runtime/pprof/
二、 runtime/pprof 的使用
该包提供了一系列用于调试信息的方法,可以很方便的对堆栈进行调试。
通常用得多得是以下几个:
StartCPUProfile:开始监控 cpu 。StopCPUProfile:停止监控 cpu,使用 StartCPUProfile 后一定要调用该函数停止监控。WriteHeapProfile:把堆中的内存分配信息写入分析文件中。
示例代码
|
1 2 3 4 5 6 7 8 9 10 11 12 13 14 15 16 17 18 19 20 21 22 23 24 25 26 27 28 29 30 31 32 33 34 35 36 37 38 39 40 41 42 43 44 45 46 47 48 49 50 51 52 53 54 55 56 57 58 59 60 61 62 63 64 |
package main import ( "flag" "runtime/pprof" "log" "runtime" "math/rand" "os" "time" ) var cpuprofile = flag.String("cpuprofile", "", "write cpu profile `file`") var memprofile = flag.String("memprofile", "", "write memory profile to `file`") const ( col = 10000 row = 10000 ) func main() { flag.Parse() if *cpuprofile != "" { f, err := os.Create(*cpuprofile) if err != nil { log.Fatal("could not create CPU profile: ", err) } if err := pprof.StartCPUProfile(f); err != nil { //监控 cpu log.Fatal("could not start CPU profile: ", err) } defer pprof.StopCPUProfile() } // 主逻辑区,进行一些简单的代码运算 x := [row][col]int{} s := rand.New(rand.NewSource(time.Now().UnixNano())) for i := 0; i < row; i++{ for j := 0; j < col; j++ { x[i][j] = s.Intn(100000) } } for i := 0; i < row; i++{ tmp := 0 for j := 0; j < col; j++ { tmp += x[i][j] } } if *memprofile != "" { f, err := os.Create(*memprofile) if err != nil { log.Fatal("could not create memory profile: ", err) } runtime.GC() // GC,获取最新的数据信息 if err := pprof.WriteHeapProfile(f); err != nil { // 写入内存信息 log.Fatal("could not write memory profile: ", err) } f.Close() } } |
编译运行,会根据入参生成两个对应的数据文件:
|
1 2 3 4 5 6 7 8 |
> go build > ./pprof -cpuprofile cpu.prof -memprofile mem.prof > ll total 2656 -rw-r--r--. 1 ma root 1183 Jan 9 21:39 cpu.prof # cpu 运行数据 -rw-r--r--. 1 ma root 280 Jan 9 21:39 mem.prof # 内存数据 -rwxr-xr-x. 1 ma root 2707088 Jan 9 21:39 pprof # 编译后的可执行文件 -rw-r--r--. 1 ma root 1296 Jan 9 21:38 pprof.go |
使用 go tool pprof 命令即可分析。
三、 go tool pprof
生成数据文件后使用 go tool pprof file 进入交互式界面进行数据分析,输入 help 可以查看命令。
用法详见:pprof.md
|
1 2 3 4 5 6 7 8 9 10 11 12 13 14 15 16 17 18 19 20 21 22 23 24 25 26 27 28 29 30 31 32 33 34 |
> go tool pprof cpu.prof Entering interactive mode (type "help" for commands) (pprof) help Commands: cmd [n] [--cum] [focus_regex]* [-ignore_regex]* Produce a text report with the top n entries. Include samples matching focus_regex, and exclude ignore_regex. Add --cum to sort using cumulative data. Available commands: callgrind Outputs a graph in callgrind format disasm Output annotated assembly for functions matching regexp or address dot Outputs a graph in DOT format eog Visualize graph through eog evince Visualize graph through evince gif Outputs a graph image in GIF format gv Visualize graph through gv list Output annotated source for functions matching regexp pdf Outputs a graph in PDF format peek Output callers/callees of functions matching regexp png Outputs a graph image in PNG format proto Outputs the profile in compressed protobuf format ps Outputs a graph in PS format raw Outputs a text representation of the raw profile svg Outputs a graph in SVG format tags Outputs all tags in the profile text Outputs top entries in text form top Outputs top entries in text form tree Outputs a text rendering of call graph web Visualize graph through web browser weblist Output annotated source in HTML for functions matching regexp or address peek func_regex Display callers and callees of functions matching func_regex. ... |
1.top
命令格式:top [n],查看排名前 n 个数据,默认为 10 。
|
1 2 3 4 5 6 7 8 9 10 11 12 13 14 15 |
(pprof) top 8490ms of 8510ms total (99.76%) Dropped 13 nodes (cum <= 42.55ms) Showing top 10 nodes out of 15 (cum >= 110ms) flat flat% sum% cum cum% 6780ms 79.67% 79.67% 8510ms 100% main.main 670ms 7.87% 87.54% 1250ms 14.69% math/rand.(*Rand).Int31n 350ms 4.11% 91.66% 1600ms 18.80% math/rand.(*Rand).Intn 260ms 3.06% 94.71% 580ms 6.82% math/rand.(*Rand).Int31 190ms 2.23% 96.94% 190ms 2.23% math/rand.(*rngSource).Int63 130ms 1.53% 98.47% 320ms 3.76% math/rand.(*Rand).Int63 110ms 1.29% 99.76% 110ms 1.29% runtime.memclrNoHeapPointers 0 0% 99.76% 8510ms 100% runtime.goexit 0 0% 99.76% 110ms 1.29% runtime.heapBits.initSpan 0 0% 99.76% 110ms 1.29% runtime.largeAlloc |
2.tree
命令格式:tree [n],以树状图形式显示,默认显示 10 个。
|
1 2 3 4 5 6 7 8 9 10 11 12 13 14 15 16 17 18 19 20 21 22 23 24 25 |
(pprof) tree 5 8250ms of 8510ms total (96.94%) Dropped 13 nodes (cum <= 42.55ms) Showing top 5 nodes out of 15 (cum >= 190ms) ----------------------------------------------------------+------------- flat flat% sum% cum cum% calls calls% + context ----------------------------------------------------------+------------- 6780ms 79.67% 79.67% 8510ms 100% | main.main 1600ms 100% | math/rand.(*Rand).Intn ----------------------------------------------------------+------------- 1250ms 100% | math/rand.(*Rand).Intn 670ms 7.87% 87.54% 1250ms 14.69% | math/rand.(*Rand).Int31n 580ms 100% | math/rand.(*Rand).Int31 ----------------------------------------------------------+------------- 1600ms 100% | main.main 350ms 4.11% 91.66% 1600ms 18.80% | math/rand.(*Rand).Intn 1250ms 100% | math/rand.(*Rand).Int31n ----------------------------------------------------------+------------- 580ms 100% | math/rand.(*Rand).Int31n 260ms 3.06% 94.71% 580ms 6.82% | math/rand.(*Rand).Int31 190ms 100% | math/rand.(*rngSource).Int63 ----------------------------------------------------------+------------- 190ms 100% | math/rand.(*Rand).Int31 190ms 2.23% 96.94% 190ms 2.23% | math/rand.(*rngSource).Int63 ----------------------------------------------------------+------------- |
3.web
以 web 形式查看,在 web 服务的时候经常被用到,需要安装 gv 工具,官方网页:https://www.graphviz.org/。
linux 用户使用 yum install graphviz 安装即可,当然,纯命令行界面是不能查看的。
windows 用户下载 msi 包安装后需要把安装目录下的 bin 目录添加到环境变量才行。
如果没有安装 gv 工具,使用会报错:
Cannot find dot, have you installed Graphviz?
exec: "firefox": executable file not found in $PATH
4. 其他
其他的都是以不同形式展现出来,大同小异,以后有时间再测试。
四、 web 服务器监测
在 web 服务器中监测只需要在 import 部分加上监测包即可:
|
1 2 3 |
import( _ "net/http/pprof" ) |
当服务开启后,在当前服务环境的 https://ip:port/debug/pprof 页面可以看到当前的系统信息:
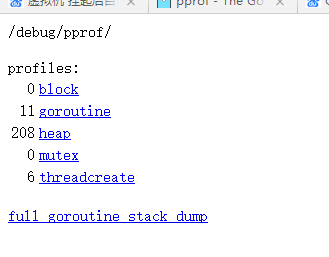
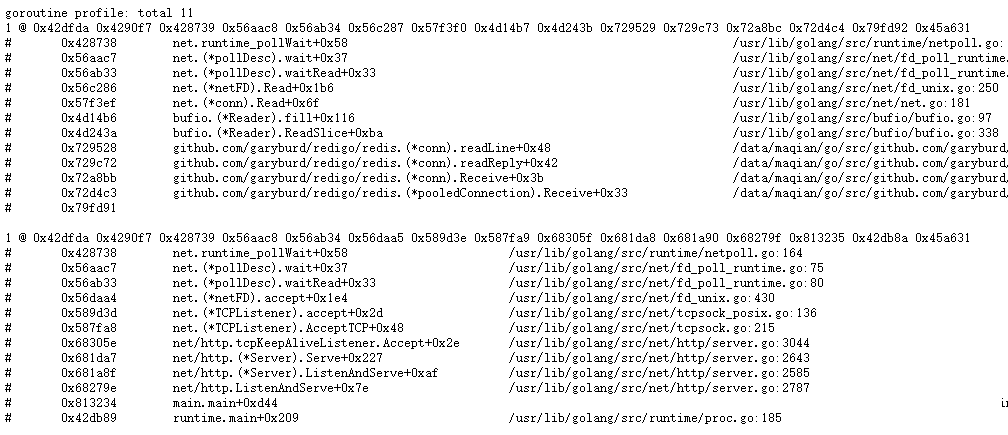
点击查看具体的信息:
通常可以对服务器在一段时间内进行数据采样,然后分析服务器的耗时和性能:
|
1 |
go tool pprof https://*:*/debug/pprof/profile |
使用该命令后会对服务进行 30s 的采样,这段时间内可以尽量多使用 web 服务,生成多一些统计数据。
|
1 2 3 4 5 6 7 8 9 10 11 12 13 14 15 16 17 18 19 20 |
> go tool pprof https://127.0.0.1:8080/debug/pprof/profile Fetching profile from https://127.0.0.1:8080/debug/pprof/profile Please wait... (30s) Saved profile in pprofpprof.127.0.0.1.samples.cpu.001.pb.gz Entering interactive mode (type "help" for commands) (pprof) top 3870ms of 4800ms total (80.62%) Dropped 37 nodes (cum <= 24ms) Showing top 10 nodes out of 66 (cum >= 110ms) flat flat% sum% cum cum% 1230ms 25.62% 25.62% 1300ms 27.08% runtime.mapaccess1_faststr 860ms 17.92% 43.54% 860ms 17.92% runtime.memclrNoHeapPointers 810ms 16.88% 60.42% 1010ms 21.04% runtime.scanobject 190ms 3.96% 64.38% 190ms 3.96% runtime.heapBitsForObject 160ms 3.33% 67.71% 190ms 3.96% strconv.ParseInt 140ms 2.92% 70.62% 1720ms 35.83% */*/server/handler.* 140ms 2.92% 73.54% 1990ms 41.46% runtime.mallocgc 120ms 2.50% 76.04% 120ms 2.50% runtime.heapBitsSetType 110ms 2.29% 78.33% 1680ms 35.00% runtime.mapassign 110ms 2.29% 80.62% 110ms 2.29% runtime.memhash |
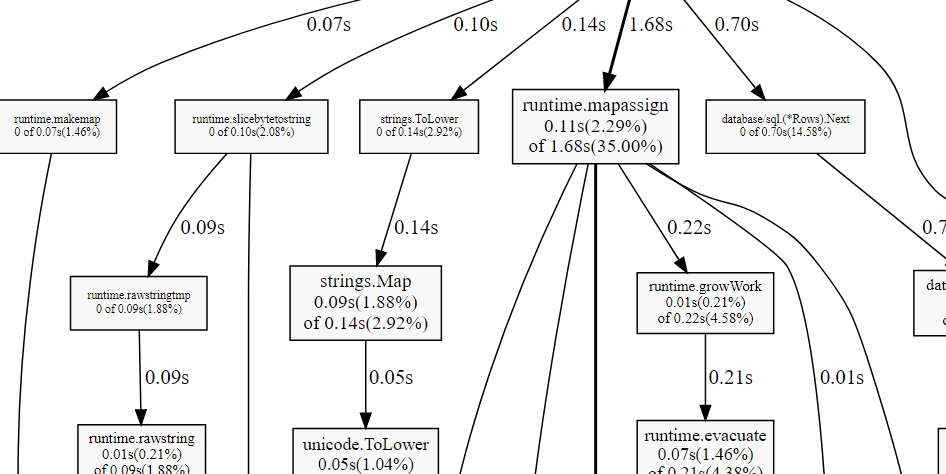
使用 web 命令后会生成采样时间内每个系统调用的耗时分析,可以用来分析 web 服务的响应时间都用在哪了: